
How to Read a Historical APR Estimate for a Tokenized-Stock LP
Concept Last verified 2026-10-19 8 min read
Suppose DeGate shows 7D Estimated APR 18% for AAPLon/USDC. It does not mean that the position earned 18% over the past seven days. It also does not promise that a 1,000 USDC deposit will gain 180 USDC over the next year.
The estimate applies the selected range and fee tier to a historical window, then expresses the modeled result as an annual rate. The current range screen offers 24H, 7D, and 30D; the numerical example below uses 7D. Its main use is comparing choices. Claimable LP fees still depend on real swaps after you open, whether your position remains in range, and how much other liquidity shares trades near the same price.
DeGate Turbo Range can display an APR backtest even when there is no realized pool trading record. Read the number as a historical simulation shown before opening, rather than a record of fees already produced by the route.
What APR means
APR stands for Annual Percentage Rate. It expresses a return from a shorter period as a one-year rate, so you can compare figures based on seven days, thirty days, or another window in the same unit.
A common simple annualization formula is:
APR = period earnings ÷ capital base × 365 ÷ number of days × 100%
For an LP, the same formula can be written as:
LP APR = LP fees generated during the period ÷ capital base × 365 ÷ number of days × 100%
The capital base may mean starting capital, average capital, or another value defined by the product. The fee figure may also be gross or net of specified costs. APRs calculated with different inputs are not directly comparable. Check the method and assumptions disclosed for Historical APR Estimate before using it to compare positions.
APR normally uses simple annualization and does not include repeated reinvestment of earnings. A product that includes compounding will usually show APY or state the compounding assumption.
Consider a basic example. An LP deposits 1,000 USDC and generates 3.45 USDC in fees over seven days. If the capital base remains 1,000 USDC and no other costs are deducted:
3.45 ÷ 1,000 × 365 ÷ 7 × 100% ≈ 18% APR
The 18% figure extends the seven-day result of about 0.345% to a one-year rate at the same pace. The position generated 3.45 USDC during those seven days, not 180 USDC. The next section applies this calculation to DeGate’s Historical APR Estimate.
Understand 18% through a 1,000 USDC position
Continue with a hypothetical AAPLon/USDC position:
| Item | Hypothetical input |
|---|---|
| Current AAPLon price | $200 |
| Price range | $180 to $220 |
| Fee tier | 0.3% |
| Deposit | 1,000 USDC through one-sided funding |
| Screen display | 7D Estimated APR 18% |
Read the number this way: when the page applies this range and fee tier to its model of the most recent seven days, the annualized result is 18%.
It does not show that the next year will repeat that seven-day price path or that the position will receive the same trading activity assumed by the model. Multiplying 18% by 1,000 USDC to claim a certain 180 USDC gain assumes that prices, volume, competing liquidity, and range status remain as modeled. The market provides no such guarantee.
Identify which kind of APR the page shows
Check the source behind an APR:
| APR type | Source of the number | What it can answer |
|---|---|---|
| Historical APR from realized pool fees | Completed swaps and fees | What the pool produced over a past period |
| Historical APR Estimate | Historical prices, the selected range, fee tier, and model assumptions | How those parameters may have behaved against past data |
Both look backward, but they do not say the same thing. If realized pool fees are available and recent trading was low, an APR based on those fees would normally reflect that. A model estimate can still show 18% because it uses a price path and stated assumptions.
A route with no realized fee history can only show the second type. It has no completed swaps or pool fee record to compare.
Why seven days can appear as an annual APR
APR expresses results from different periods on a one-year basis. 7D identifies the historical window used by the model. It does not mean that the capital ran for a year.
Annualizing also magnifies the effect of a short period. If the price remained inside a narrow range for most of the last seven days, the annualized estimate may look high. Earnings, a reopening gap, or a larger move in the next week can take the position out of range earlier and produce a different result.
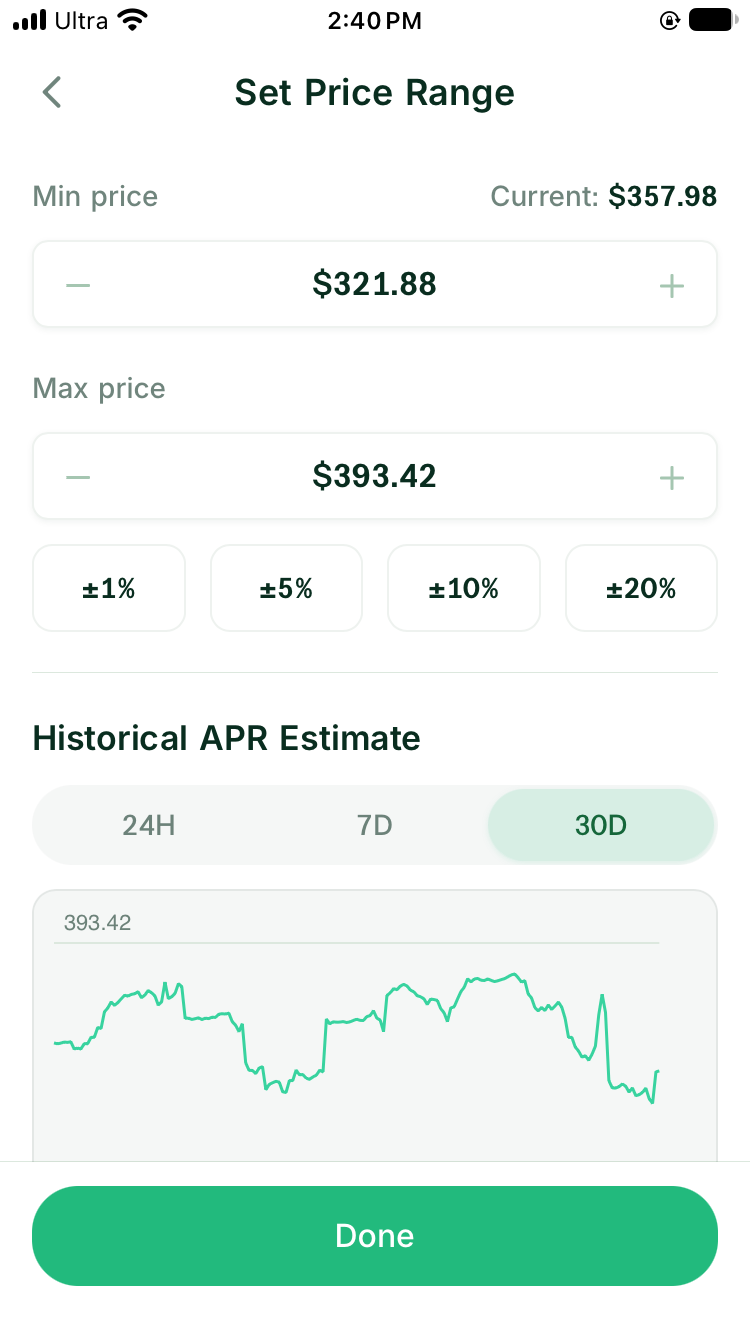
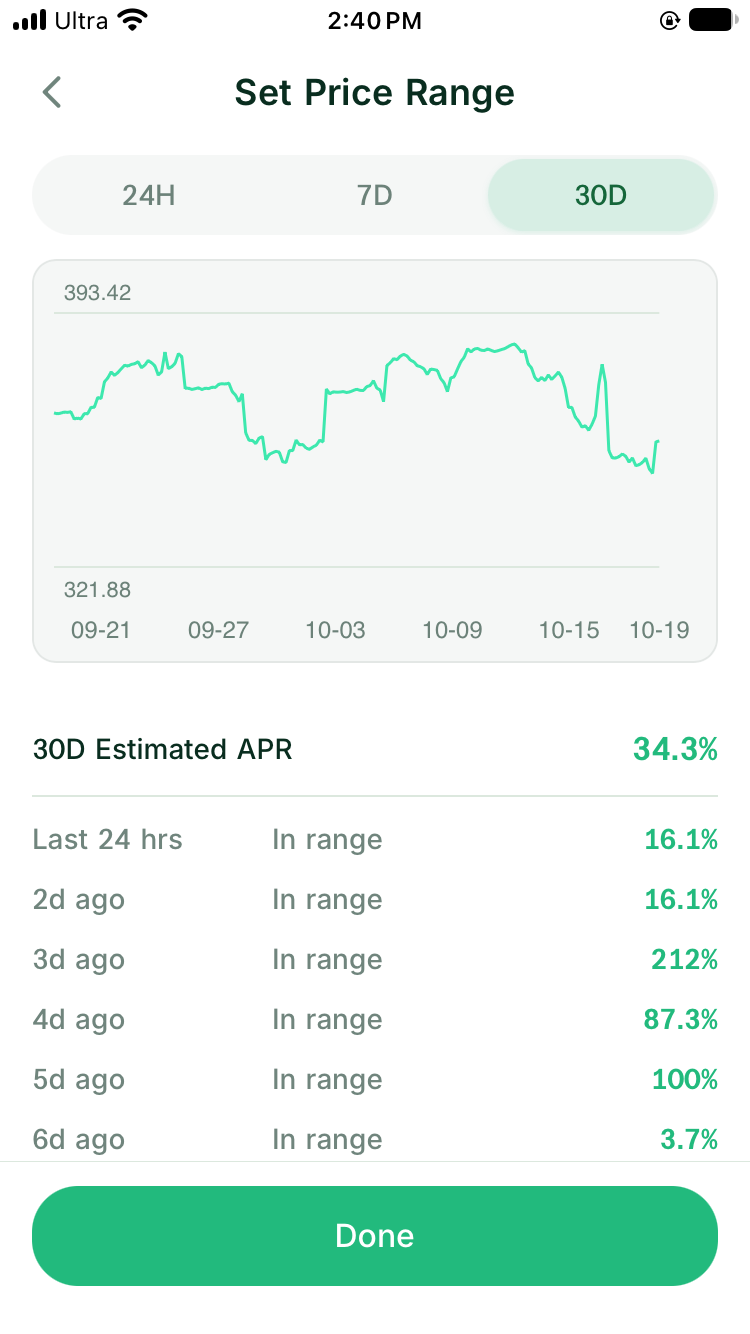
The shorter the window, the more closely you should inspect whether those days resemble the market conditions you expect. Read the price path and range status alongside the APR. The screenshots below show 30D selected, while the worked example above uses 7D. Compare estimates within the same window.
Read the backtest chart
Follow the price from left to right and check whether it stays between the bounds. If it crosses a boundary, note when the position becomes Out of Range and whether it later returns.
Then inspect the asset change. Near the upper bound, the modeled position reduces AAPLon and adds USDC. Near the lower bound, it does the opposite. Two ranges with similar APR estimates can finish with different asset mixes.
Read the fee assumptions too. Check how the model uses the price path, fee tier, and assumed activity. If the method is unavailable, keep that gap in your notes and use completed fee records to review actual income.
Hold other inputs constant when comparing ranges
Suppose the page shows:
- $195 to $205: a higher Historical APR Estimate
- $180 to $220: a middle estimate
- $160 to $240: a lower estimate
The first range is not automatically better. It concentrates the same capital near $200, which can raise modeled fee efficiency. It also goes out of range first if the price reaches $206 or $194.
Keep the token, deposit, fee tier, and historical window unchanged when comparing ranges. Put the APR next to:
- time spent in range
- the asset held after crossing a bound
- whether you would check or reopen around the same market event
If you change the fee tier, amount, and range at once, you cannot tell which choice produced the APR difference.
Pair the estimate with the live position record
The Historical APR Estimate cannot determine:
- how many future swaps will use the pool
- the future price path
- how much competing liquidity will join near the current price
- quote spreads and network costs for opening, increasing, claiming, or closing
- when you will close and which assets the position will return
Two users can both see 18%. One position may later receive steady swaps, while another may see little trading for some time. Their claimable fees can differ completely.
DeGate connects the choices made before opening with the position record that follows. The range screen places the current price, bounds, and Historical APR Estimate together. Review Investment lists the original input. If the flow uses an auto-swap, it also lists the resulting stock-token and USDC amounts.
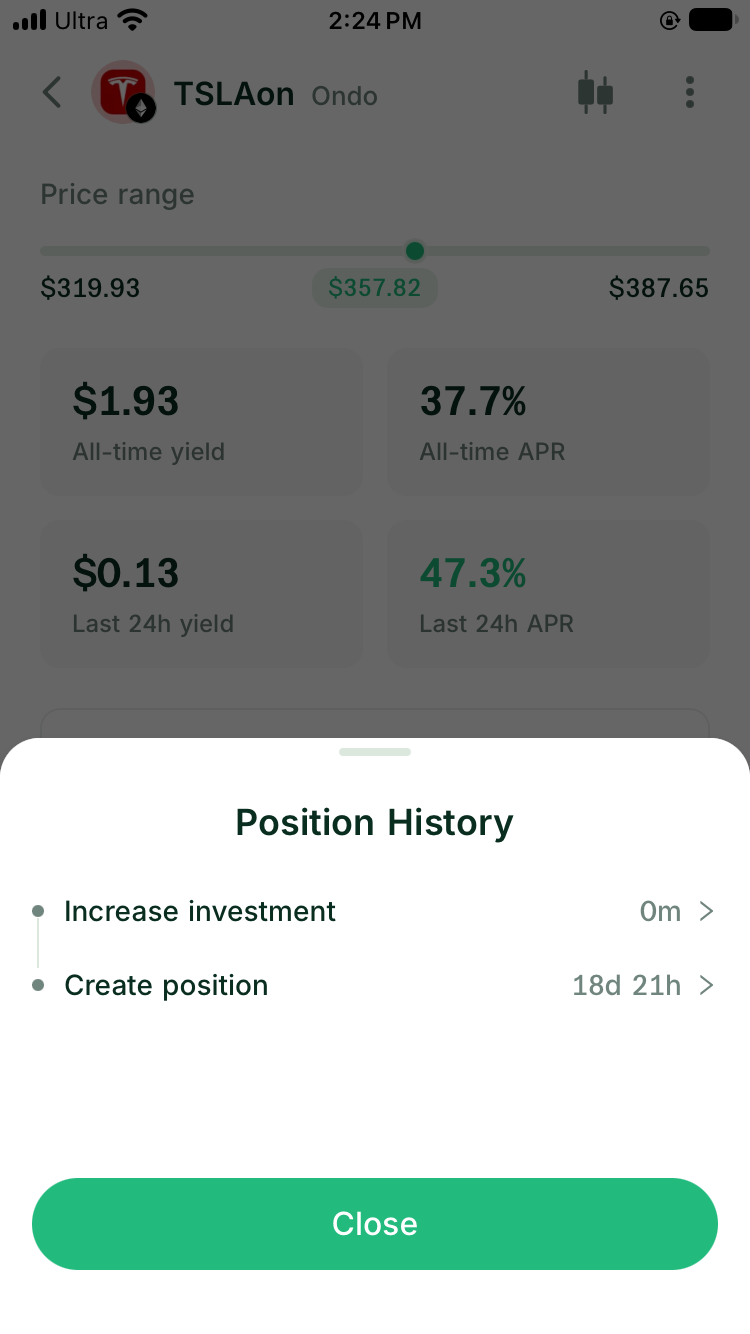
After an opening or increase completes, Position History and History Details let you review each deposit, auto-swap, pair, and fee tier. Position Details retains Initial entry price as a separate long-term field and continues to show the range and network. Turbo Range also shows All-time APR and Last 24h APR for cumulative and recent performance. These figures use data from the running position and serve a different purpose from the pre-opening 7D Estimated APR.
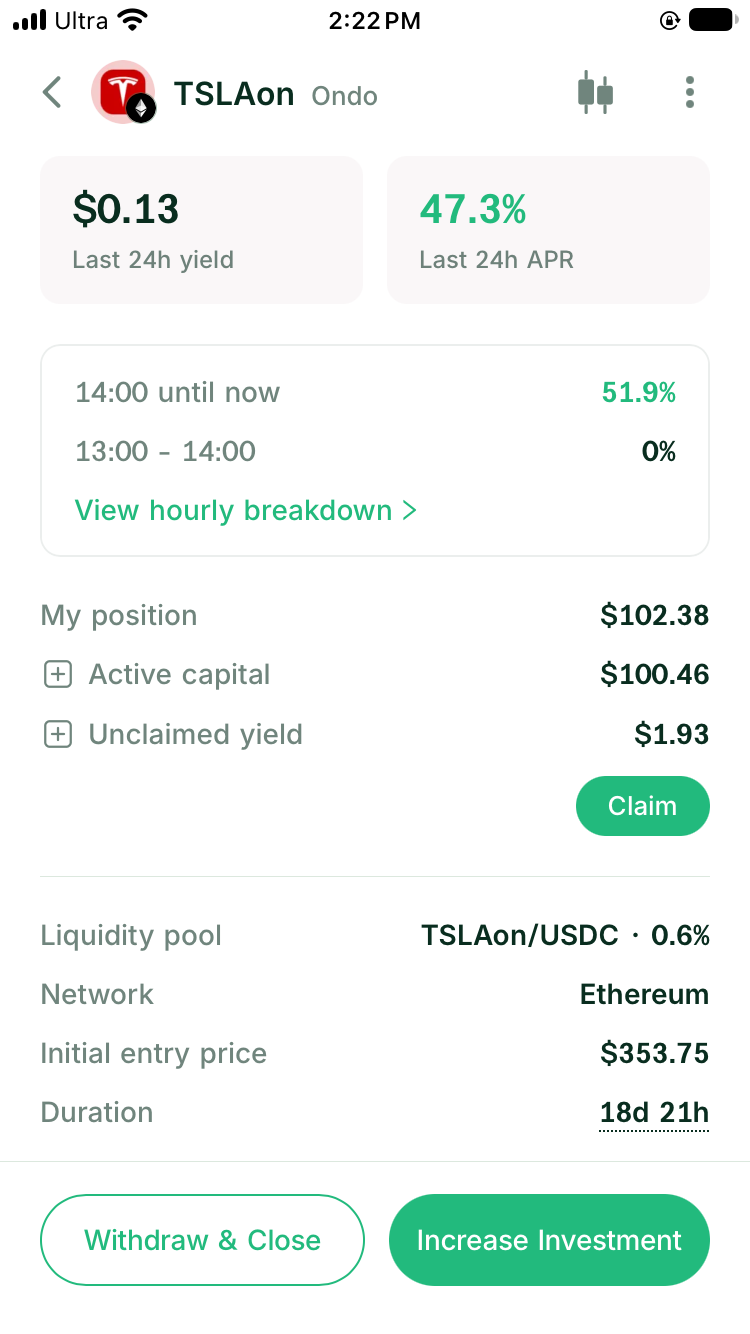
Claiming fees does not break that record. In the current DeGate Turbo Range, previously claimed fees remain included in cumulative yield. Claiming reduces the unclaimed fee balance because those assets have moved to the wallet.
These records matter when capital changes. If a position rises from 1,000 USDC to 1,400 USDC, the history may show that you added another 300 USDC. Remove that addition before calculating the return, or your own deposit will look like LP earnings.
Use the estimate in DeGate
- Confirm the stock token, pool, and fee tier.
- Set bounds whose asset outcomes you accept.
- Select 24H, 7D, or 30D for the Historical APR Estimate and inspect the backtest price path.
- Try a wider or narrower range with the same deposit and historical window.
- Compare when each range became inactive and which asset it held afterward.
- Before opening, use
Review Investmentto confirm the original input and the two asset amounts after any auto-swap. - After opening, use the position details and history to read cumulative results and separate later additions from earnings.
Choose an asset you want to hold and bounds whose outcomes you accept, then use APR to compare those choices.
FAQ
Is 7D Estimated APR the return actually earned over seven days?
Not necessarily. With 7D selected, DeGate Turbo Range’s Historical APR Estimate applies the selected parameters to the most recent seven days of historical data. The range screen also offers 24H and 30D windows. Review any realized fees separately when that history is available.
Why can APR appear when there is no realized pool fee history?
The backtest uses historical price data and model assumptions, so it does not require past pool trades. The display is an estimate, not a realized pool return.
Does 18% APR mean about 1.5% each month?
Dividing 18% by 12 does produce 1.5%. That calculation assumes each coming month keeps the same earning pace as the backtest. Actual fees change with trading volume, prices, range status, and competing liquidity, so 1.5% is a mathematical conversion rather than an expected return for next month.
How can I compare the historical APR estimate with the result after opening?
Start with the original deposit and every later increase in DeGate’s position history. Then review accumulated fees, All-time APR, and recent APR over a matching period and capital base. Cumulative yield still includes fees claimed earlier. The next guide uses a complete example to explain how to calculate and compare a stock LP position.
What is the difference between APR and APY?
APR normally uses simple annualization without reinvesting earnings. APY includes the effect of compounding. Before comparing two figures, check whether each page shows APR or APY and whether it deducts fees and costs.
Should I choose the range with the highest APR?
Not by itself. A higher estimate can come from a narrower range. The capital is more concentrated while active, but a smaller price move can take it out of range.
Sources
Facts on this page were last verified on October 19, 2026. Product capabilities, supported assets, and fees can change; the linked sources are the current record.